
Which’s Brew is a Windows desktop application that provides planners the capability to:
- Quickly and intuitively view data relationships over a range of selectable criteria
Compare two data set variables (x- and y-axes) as they relate to one or more other data set properties (series/z-axis) - Import modeling and simulation data from comma separated value (CSV) files
- Dynamically combine data tables from multiple, uniformly formatted data sets
- Easily save images of data relationships to communicate observations
Which’s Brew is designed to be data agnostic to ensure extensibility across different data sets, but it does require uniformly formatted spreadsheet data tables for appropriate display. Spreadsheet data can be edited in Which’s Brew to ensure data compatibility.
Components
Which’s Brew consists of the following components:
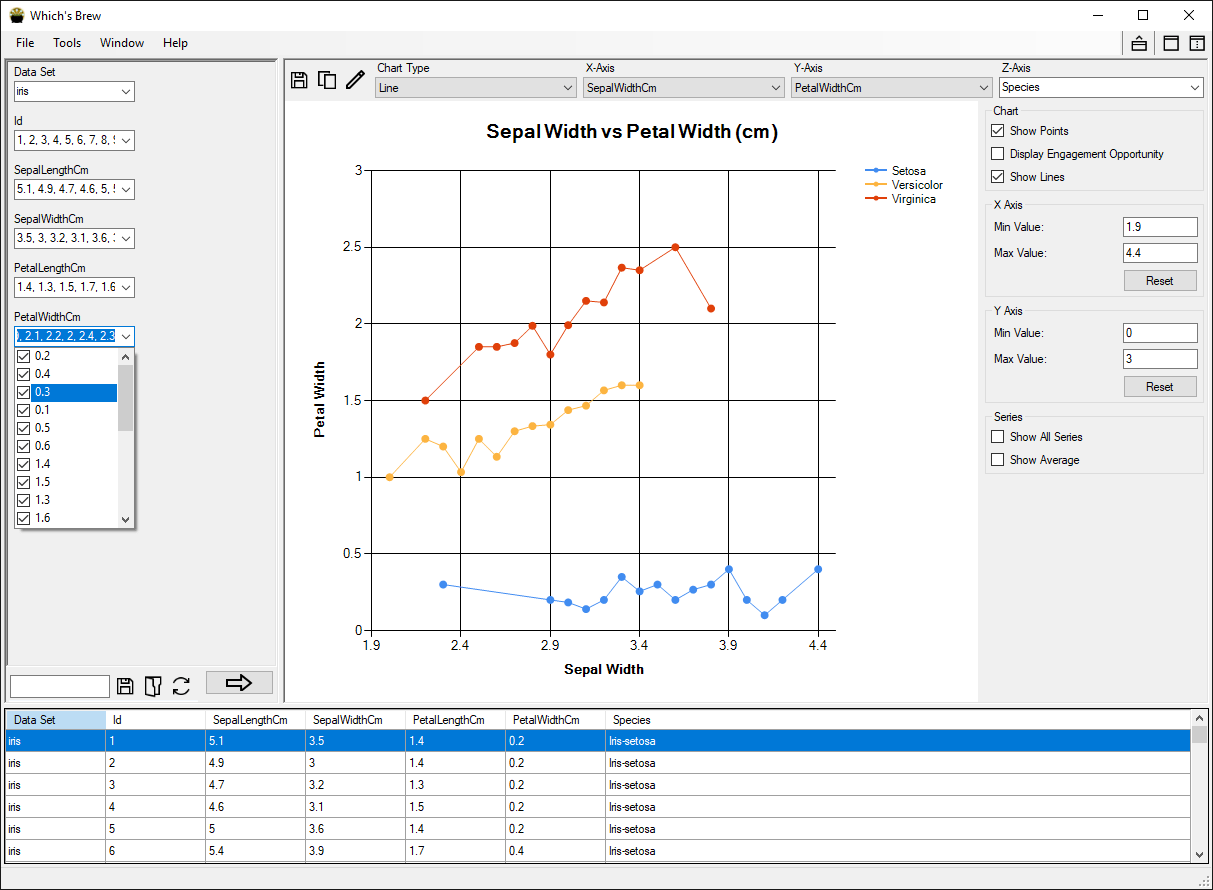
- Main Window – the primary application view in which users can filter data sets and plot relationships of filtered data
- Data Set Creator – allows users to combine spreadsheet files (*.csv) into Which’s Brew data files
- Data Set Manager – allows users to load specific data sets from Which’s Brew data files and delete data sets used by the application
- Configuration Manager – allows users to configure elements of Which’s Brew, including which filters are shown, how filters are displayed, and default plot characteristics
Why use it?
Which’s Brew is a simple, easy-to-use alternative for operations commonly performed with Microsoft Excel pivot tables. It allows users to combine and filter multiple data tables and to see comparisons, patterns, and trends in the filtered data.
Questions?
For further details, please contact us.